The Heap Analyzer is a set of tools to help developers understand the content of the Java heap and find problems such as memory leaks.
See Heap Dumper & Heap Analyzer documentation to learn more about Heap tools usage.
This tutorial describes how to dump the VEE Memory from a running device in order to analyze it using the Heap Analyzer.
![]() This tutorial is compatible with MICROEJ SDK 5, MICROEJ SDK 6 Heap Dumper documentation is available here.
This tutorial is compatible with MICROEJ SDK 5, MICROEJ SDK 6 Heap Dumper documentation is available here.
The below procedure allows to dump VEE memory in a Mono-Sandbox context. Refer to the following documentation to dump VEE memory in a Multi-Sandbox context: Generate VEE memory dump script.
Requirements
- IAR EmbeddedWorkbench version 8.x or 9.x.
- Debug probe attached to a running device.
1) Get the IAR Memory Dump Script
The IAR Memory Dump script is used to automate the heap dump.
Get the proper script, depending on your IAR EmbeddedWorkbench version:
- heapdump_iar8.x.zip (599 Bytes)
- heapdump_iar9.x.zip (602 Bytes)
2) Retrieve the .hex File from the Device
-
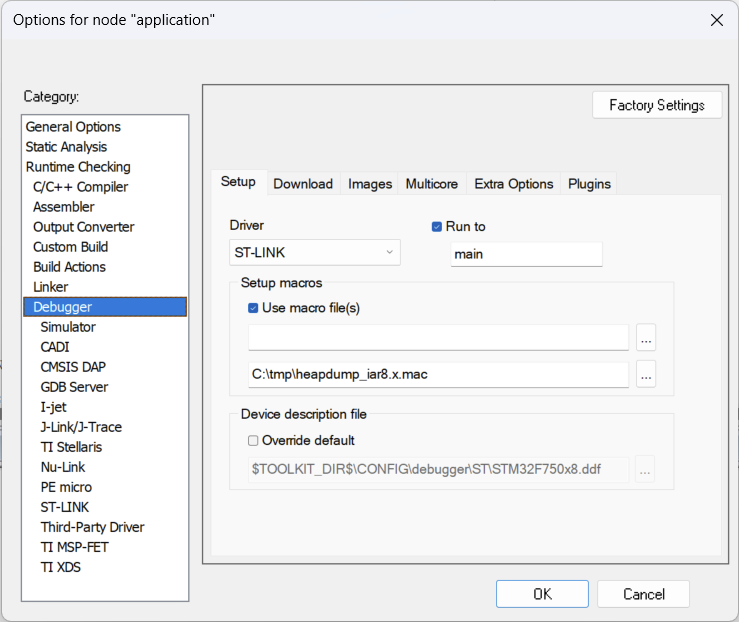
Register the downloaded
.macscript in the debugger project option:- Open the Debugger Project option window by clicking on
Project > Options... > Debugger > Setup, - Check the option
Use macro file(s)and browse to the.macfile, - Click on
OKto confirm:
- Open the Debugger Project option window by clicking on
-
Run your code in debug mode in IAR (or attach to the running target).
The .mac file contains a heapdump() method that allows to dump the VEE memory.
The output folder can be edited in the .mac file.
The default folder is C:\tmp, note that the tmp/ folder needs to be created before script execution, otherwise the script will fail.
3) Trigger the Heap Dump
The heapdump() method can be triggered in several ways.
Trigger the Dump from a Native Function
-
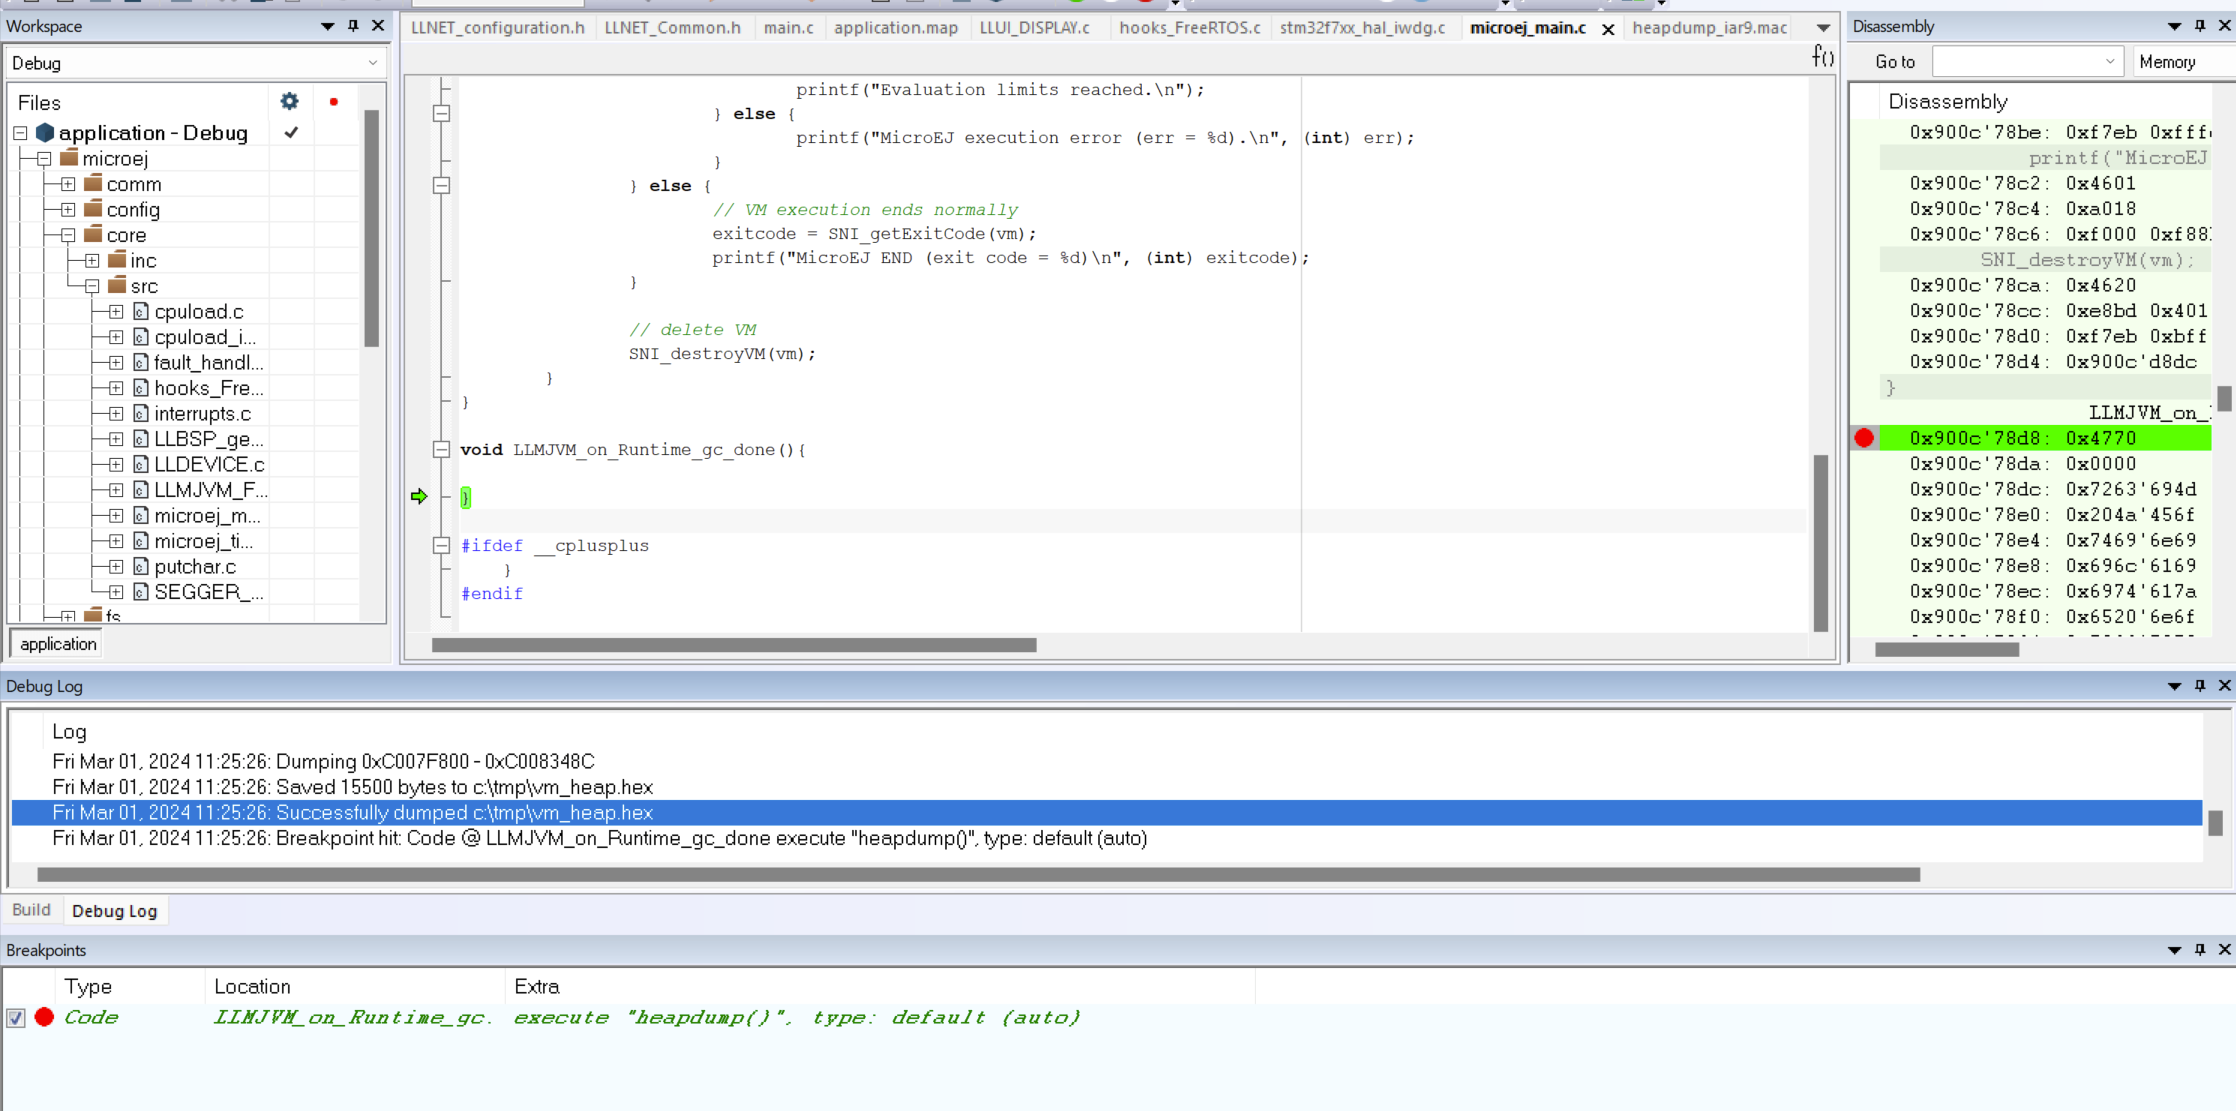
In this example, the GC done hook is used to trigger the VM Dump. It is called when calling explicitly a
System.gc();in the application, -
Add the following function in your C code:
void LLMJVM_on_Runtime_gc_done(){ } -
Add the macro
heapdump()as an action expression to a code breakpoint:- Open IAR Breakpoints window by clicking on
View > Breakpoints, - Right-Click in the
Breakpointswindow and selectNew Breakpoint > Code,- In the
Break attext field enter:LLMJVM_on_Runtime_gc_done - In the
Expressiontext field enter:heapdump() - Click on
OK.
- In the
- Open IAR Breakpoints window by clicking on
-
When
System.gc()will be triggered from the application, the debugger will hit the breakpoint, theheapdump()macro function is executed and the memory is dumped into a*.hexfile:
-
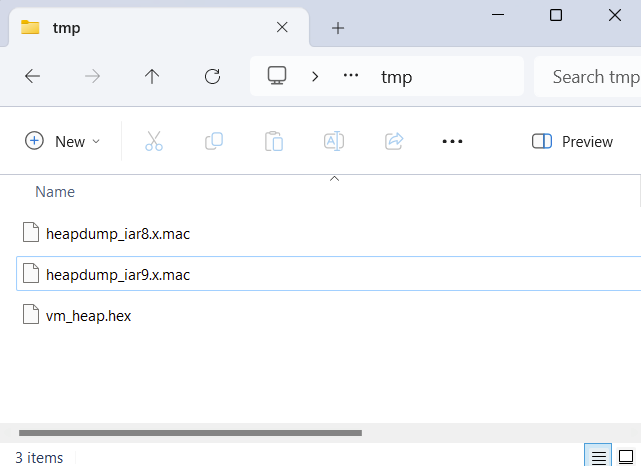
The
vm_heap.hexfile is available in thetmp/folder:
Trigger the Dump from the Debugger View
![]() This method may lead to inconsistent memory dumps if the VEE is running while the dump is triggered.
This method may lead to inconsistent memory dumps if the VEE is running while the dump is triggered.
-
In IAR, enable the
View > Quick Watchview, -
Pause the debugger,
-
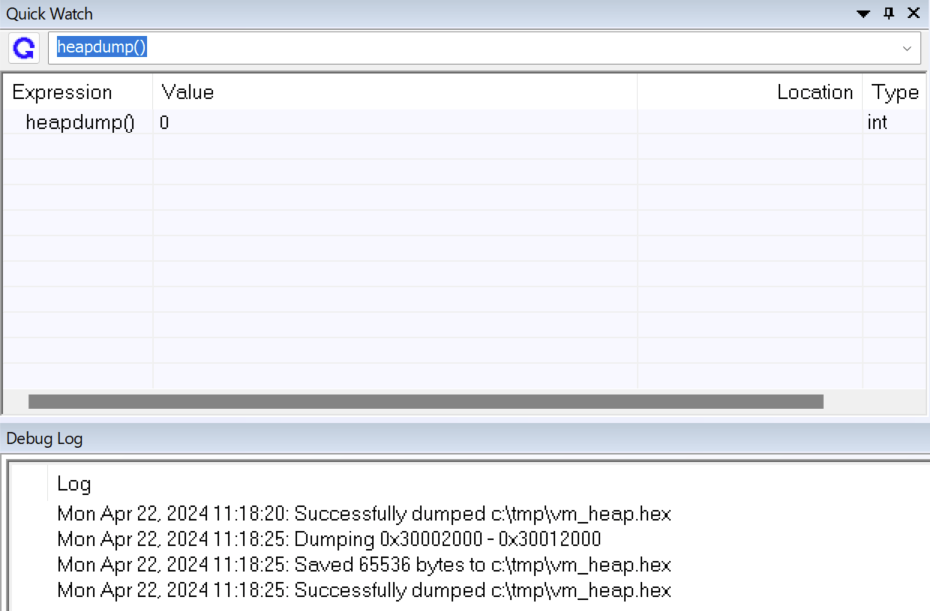
In the Quick Watch field, write
heapdump()and press enter:
-
The memory is dumped in a
.hexfile in thetmp/folder.
4) Visualize the Heap Dump
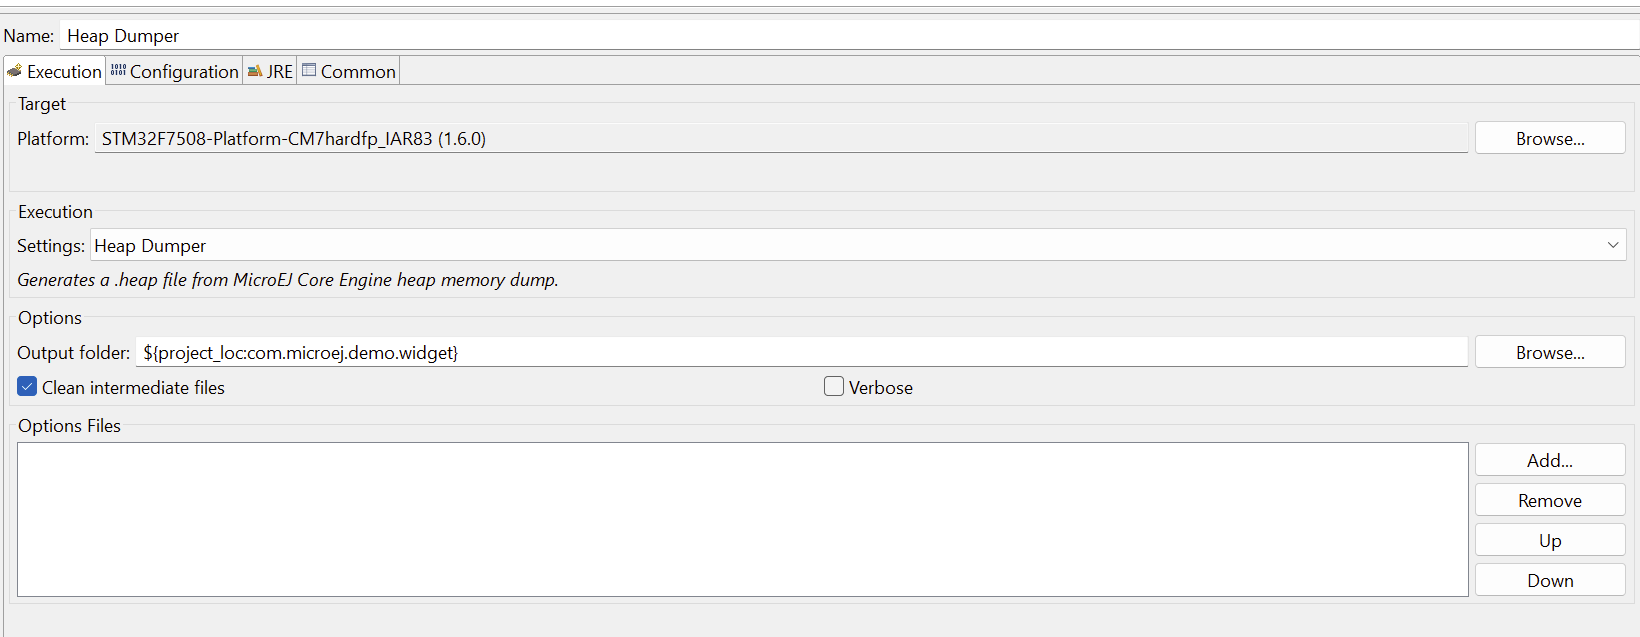
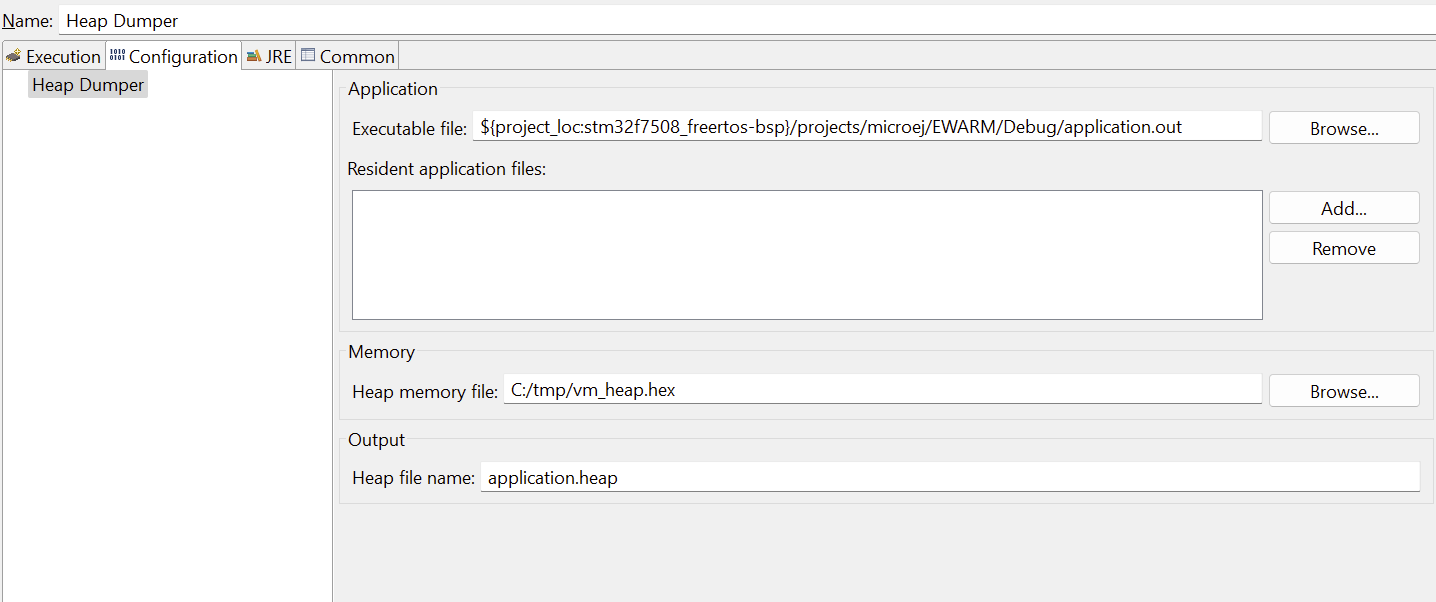
- In MICROEJ SDK 5, setup the Heap Dumper MICROEJ Tool to generate a
.heapfile from the.hexmemory dump:
- Click on
Runto execute the heap dumper tool, - An
application.heapfile is generated in the output folder specified in the launch configuration, - Use the Heap Viewer tool to inspect the content of the heap.
Alex for MicroEJ